Matplotlib is used for creating plots and charts.
– Call line plot function: .plot()
– Set properties such as labels and colors
– Display plot: .show()
This recipe includes the following topics:
- Draw Line Plot
- Set line color
- Set x & y axis labels
- Show legend
Line plot
# import module
import matplotlib.pyplot as plt
import numpy as np
# create numpy array
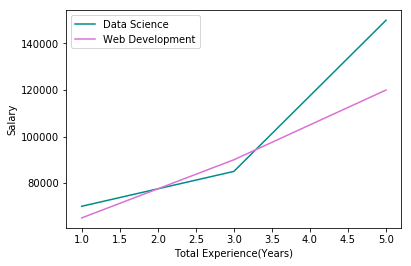
experience = np.array([1, 3, 5])
salary_ds = np.array([70000, 85000, 150000])
salary_web = np.array([65000, 90000, 120000])
# call plot function
plt.plot(experience, salary_ds, color='darkcyan', label='Data Science')
plt.plot(experience, salary_web, color='orchid', label='Web Development')
# set axis labels
plt.xlabel('Total Experience(Years)')
plt.ylabel('Salary')
# show legend
plt.legend()
# draw plot
plt.show()