Matplotlib is used for creating plots and charts.
– Call scatter plot function: .scatter()
– Set properties such as labels and colors
– Display plot: .show()
This recipe includes the following topics:
- Draw Scatter Plot
- Set x & y axis labels
- Set x-axis range
- Show legend
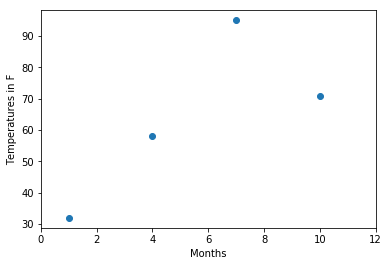
Scatter plot
# import module
import matplotlib.pyplot as plt
import numpy as np

# create Numpy array
temperatures = np.array([32, 58, 95, 71])
months = np.array([1, 4, 7, 10])

# plot function
plt.scatter(months, temperatures)

# set axis labels
plt.xlabel('Months')
plt.ylabel('Temperatures in F')

# set x-axis range
plt.xlim(0,12)

# display plot
plt.show()