Histograms are useful to quickly check the distribution of data in each column.
The shapes of Histograms are mostly:
– Gaussian (Normal distribution) or
– Skewed (Left or right)
Note: Most machine learning algorithm focuses on Gaussian distribution.
This recipe includes the following topics:
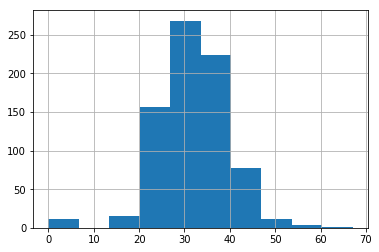
- Draw a Histogram for a particular column
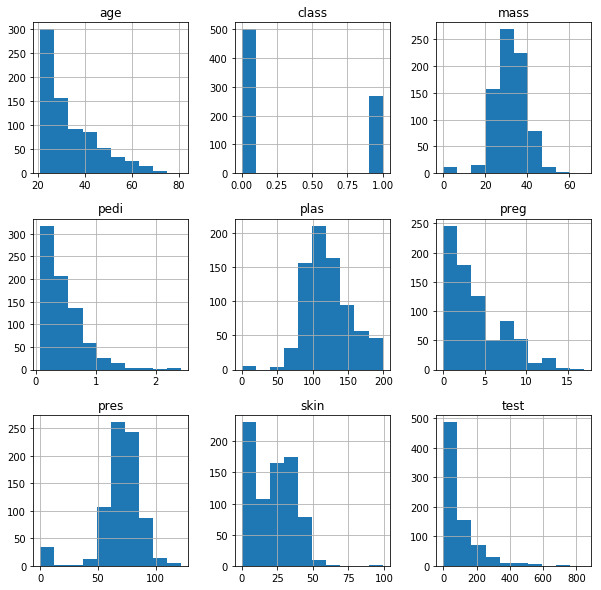
- Draw Histograms for all columns
- Increase histogram’s size
# import module
import pandas as pd
import matplotlib.pyplot as plt

fileGitURL = 'https://raw.githubusercontent.com/andrewgurung/data-repository/master/pima-indians-diabetes.data.csv'

# define column names
cols = ['preg', 'plas', 'pres', 'skin', 'test', 'mass', 'pedi', 'age', 'class']

# load file as a Pandas DataFrame
pimaDf = pd.read_csv(fileGitURL, names=cols)

# Histogram of a single column 'mass'
pimaDf['mass'].hist()

# Histogram of a all columns
pimaDf.hist(figsize=(10,10))

plt.show()